AskScout
iPhone App
Creating a tool to communicate potential
safety risks near your current location and
the places you care about most
The problem
Americans fear for their safety
According to a recent study conducted by Chapman University, about 30% of Americans are afraid or very afraid for their personal safety against violent crimes. At the same time, homicide rates across the United States have also increased by 30%. The correctional between the two makes sense why people are afraid.
Source: America's Top Fears
Source: FBI Uniform Crime Reporting
Competition & Opportunity
Current products only
focus on past crime
Whether viewed on the local news, social media, a crime mapping website, or a crime app, most people can stay informed about recent crimes occurring in their city. But
with each of these outlets, information is generalized to the community, potentially omitting some details. Similarly, viewers
are only informed about crimes that have occurred, leaving them to keep mental notes to help them at each moment.

Strategic Goal
Utilizing the AskScout Risk Score, develop a tool to communicate current and forecasted levels of risk for
a specific location and time
of day.
AskScout Mission
Help users become
more aware of their surroundings to make better, safer decisions and reduce their fear for personal safety.
Device Requirements
Not all users share their
exact location

As a result of recent privacy trends and tech companies developing new features to protect user information, users can customize the amount of location data they are comfortable sharing with each application. Due to these new device requirements, a best-in-class product needs to provide an engaging experience regardless of the amount of
shared location data from a mobile device.
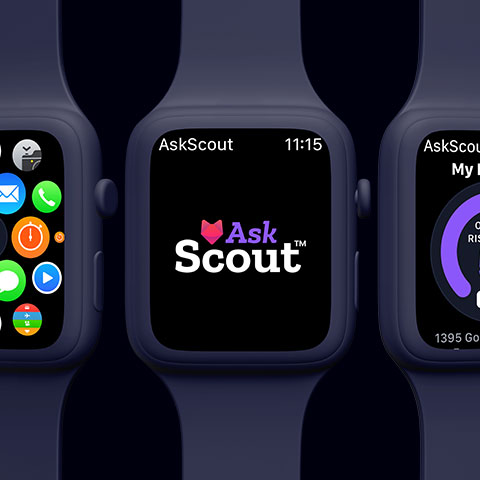
Communicating Risk
Location-specific risk information
accessible via iOS
Through feature development
and continuous shipping, we’ve developed an iOS application that communicates current and forecasted levels of potential risks calculated using the AskScout risk measurement system.
Risk Score
Communicating risk to the hour
Motivated by the question of “Am I safe
right now?” we’ve focused our efforts on communicating current levels of risk to users. By leveraging shared location data, each risk score uses recent nearby incidents to calculate the potential risk for the present hour, providing the best understanding of potential risks right now, where someone is standing or near any location of interest.
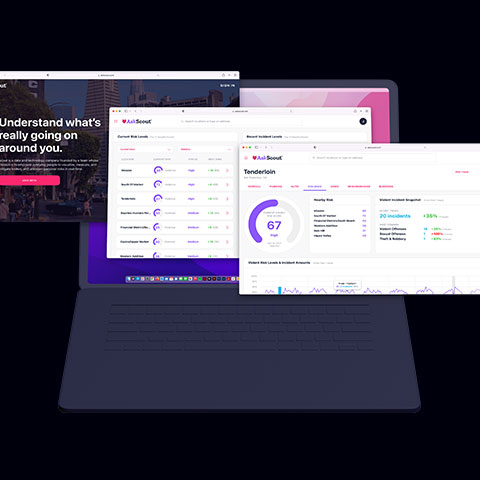
Risk Details
Organizing risk by
user-friendly categories
Finding valuable details can be difficult with large amounts of data. For this reason, similar crime types are grouped into user-friendly categories, helping us calculate focused risk scores. After averaging each score into a single overall score, users can quickly understand the general risks of their location and dive deeper into each different type of risk.
Risk Map
Exploring risk across the city
"What about the risks of where I am going? Will I be safe?" By developing map features, users can quickly search or drop pins to access current risk information for each
place of interest.
Risk Notifications
Staying aware of current risks
Since risk consistently changes throughout the day, it becomes difficult to know when it might spike. By developing features to notify users when risk changes, users can stay updated as it fluctuates throughout the day.
Risk Personalization
Customizing risk into
a unique score
With the wide variety of crimes occurring throughout a city, not all users are concerned about the same types of incidents. By developing customization features, users
can personalize the overall risk score by
only activating each risk type that concerns them the most.
Key Learnings
Learning and building
helped us innovate
As feature development progressed, key learnings helped us continually improve the user experience and communicate detailed risk information.


Users need to see what
calculates each score
When viewing risk for a location, we found that users quickly understood which categories had higher risk levels but weren’t sure what types of incidents calculated that risk. By displaying recent incident amounts alongside each score, users can now understand the details that comprise that score.


Users need to see how
current risk compares
When viewing the risk for the current time, users were curious how it compared to the rest of the day. Inspired by how weather apps communicate daily temperatures, we have begun implementing new features to calculate daily high, low, and average scores of a location to provide users more context of their current risk levels and how they compare.


Users want to see how the
location is trending
When viewing the current risk for a location, it was difficult to understand if that risk was improving or getting worse. By displaying incident statistics alongside each incident amount, users can understand which incidents to be concerned about most and how they are trending at that location.
Early Insights
Risk is not always in
the front of our minds
Learning how users think of risk has helped inform a better business strategy.
With the mentality to quickly prototype and learn, our team has consistently live-tested each release in San Francisco, helping us gather feedback and evaluate how users think of risk. As a result, we’ve found that most users are not constantly worried about risks. Instead, their worry creeps up when they are outside their usual routines and in places they don’t know. With this insight, we’ve been able to tailor our business strategy to focus on specific markets while shipping the beta release of our product.


With the mentality to quickly prototype and learn, our team has consistently live-tested each release in San Francisco, helping us gather feedback and evaluate how users think of risk. As a result, we’ve found that most users are not constantly worried about risks. Instead, their worry creeps up when they are outside their usual routines and in places they don’t know. With this insight, we’ve been able to tailor our business strategy to focus on specific markets while shipping the beta release of our product.
Next steps
Continuing to learn
and improve
With an MVP beta product released, the focus has now shifted from feature development to refinement, continuously learning along
the way to make improvements.
Engaging users with insights
As we focus on acquiring users for our beta release, attention towards new features that provide insights into risk has grown.

Viewable account details
across products
As users continue to save locations and personalize their risk settings, we want to ensure all account information is accessible across each
AskScout product.

Continuing to refine features
With an MVP product released in beta form, our goal is to refine each feature with user feedback and continuously learn how user’s think of risk, helping us iterate and improve the effectiveness of each score.