AskScout
Risk Score
Developing a system to measure the potential risks
near a location using recent crime incidents
The problem
Americans fear for their safety
According to a recent study conducted by Chapman University, about 30% of Americans are afraid or very afraid for their personal safety against violent crimes. At the same time, homicide rates across the United States have also increased by 30%. The correctional between the two makes sense why people are afraid.
Source: America's Top Fears
Source: FBI Uniform Crime Reporting
Competition & Opportunity
Current products only
focus on past crime
Whether viewed on the local news, social media, a crime mapping website, or a crime app, most people can stay informed about recent crimes occurring in their city. But
with each of these outlets, information is generalized to the community, potentially omitting some details. Similarly, viewers
are only informed about crimes that have occurred, leaving them to keep mental notes to help them at each moment.

Strategic Goal
Utilizing public crime data, develop a system that calculates predictive levels of risk for a specific location and time of day.
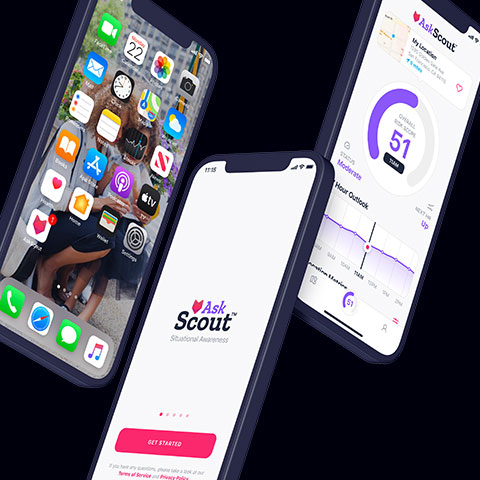
AskScout Mission
Help users become
more aware of their surroundings to make better, safer decisions and reduce their fear for personal safety.
Finding Data
Public data is messy, but
it has potential
Before jumping into creating a risk measurement system, we needed to find reliable sources of crime data and immerse ourselves.
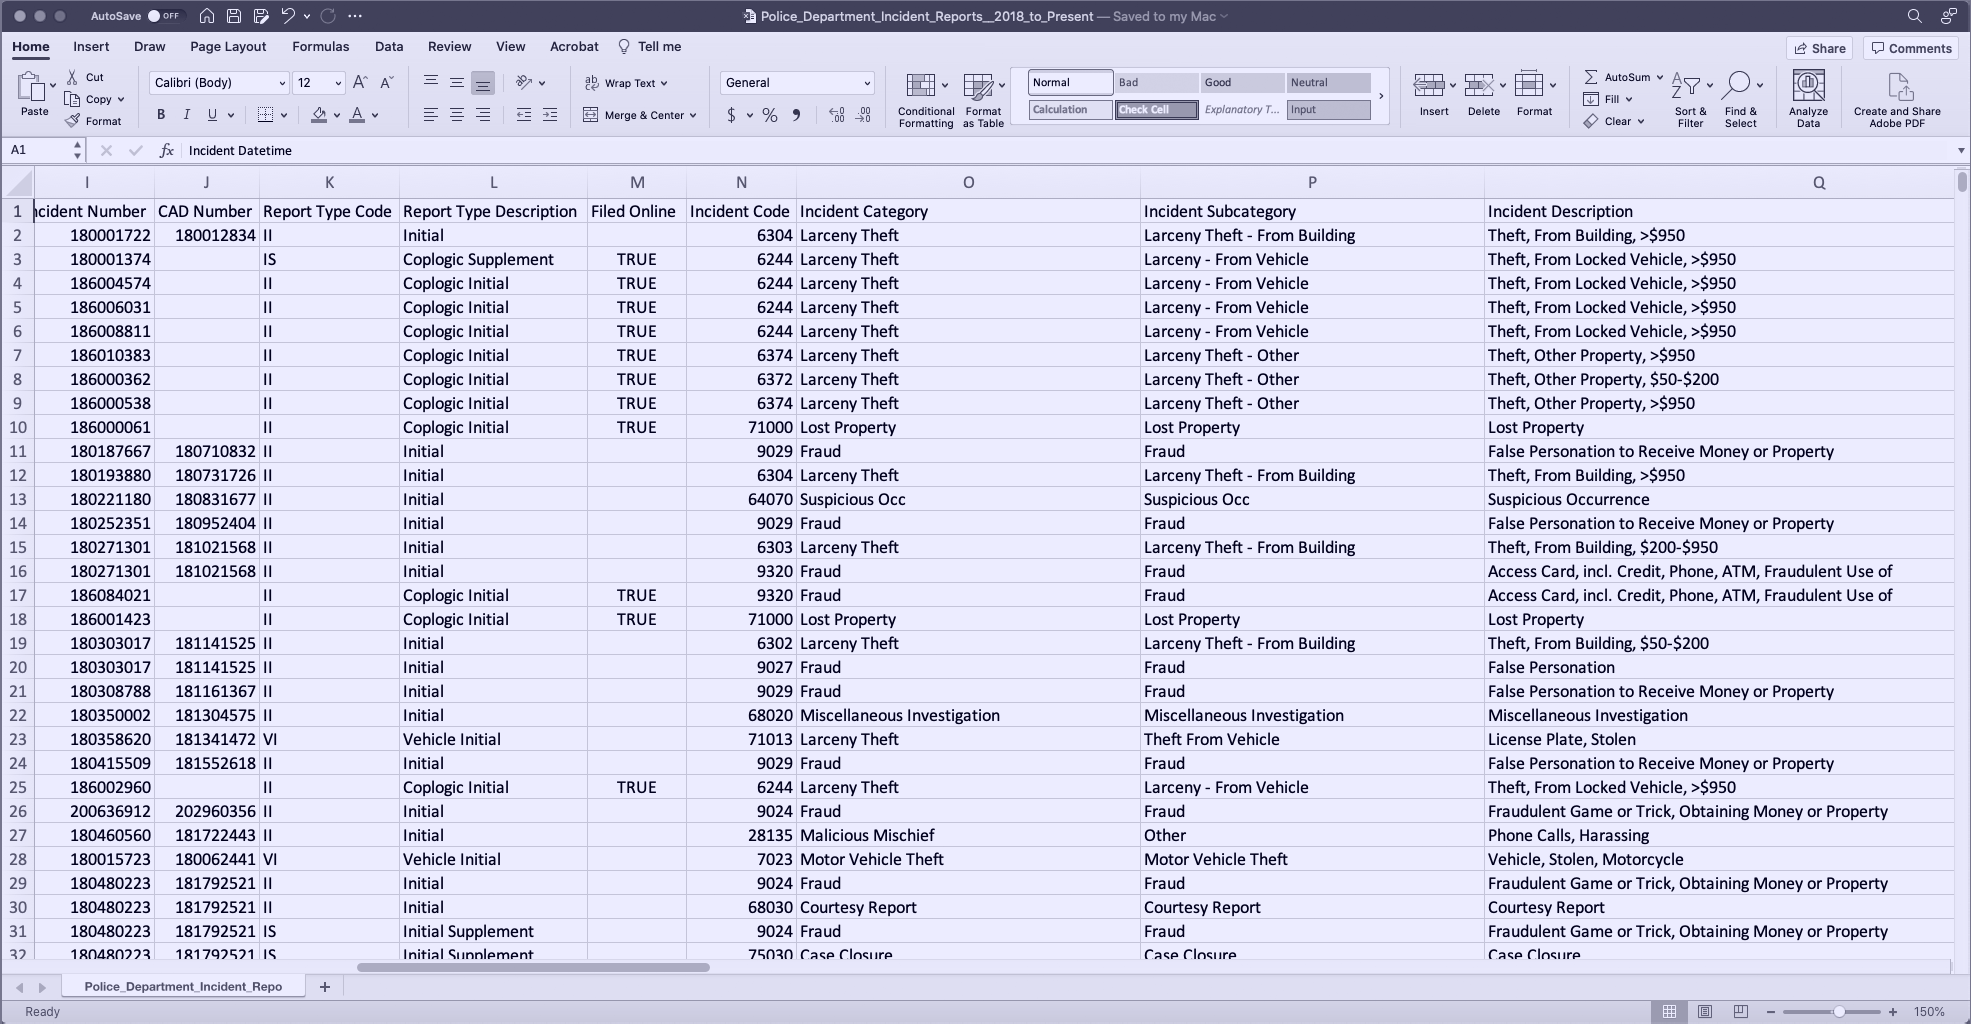
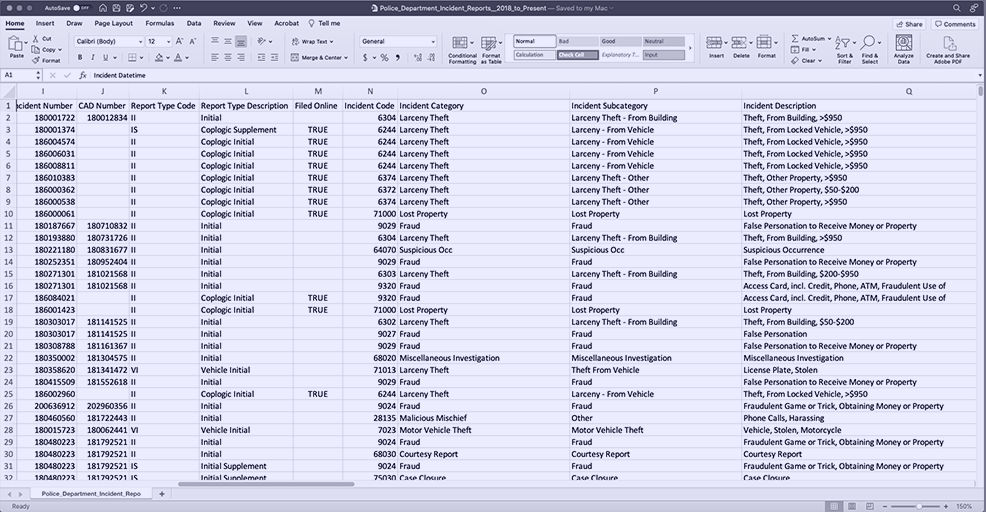
Raw incident data of San Francisco, CA viewed in Excel.
Public data brings challenges
Large municipalities provide public access to their police crime data, but pulling insights and analysis would be a burdensome task to achieve for most consumers. As a result, answering the simple question of “What incidents have occurred near me?” becomes a difficult task. Such hurdles include:
- Immense file sizes
- Data is not user friendly
- Classification differs from city to city
- Data is published at different time intervals
- All data is at least a day old
The integrity of public data is crucial
By relying on a single source of published crime data for each city, typical for most municipalities, any product would be at the whim of the integrity of that dataset. For example, the accuracy and timeliness of reported incidents could potentially affect the performance of that product. As a result, we focused on providing a consistent experience regardless of data delays and inaccurate incident reporting.
Developing a Pipeline
Transforming raw data into
something usable
With datasets identified and requirements defined, our focus was on developing a data pipeline to fuel ML modeling.


Developing an automated data
pipeline provided a constant feed
Working through the hurdles
of using public data and continuously iterating, our team designed and developed a proprietary automated system that ingests, classifies, and stores crime incident data into a usable format for ML modeling.

User-friendly language helped simplify
categories for ML modeling
During our classification process, we revise each incident description with user-friendly language to increase the usability of complex incident codes. We then group similar incidents into specific risk categories. This step is crucial within our data pipeline, allowing us to create risk scores and analytics based on similar incidents, such as violent crime, automotive crime, parking tickets, home burglaries, etc. Through continuous testing, we evaluate each risk category and improve its usability.

Organizing incidents by location
helped focus data for ML modeling
By approaching a city as a grid, we can parse recent incidents by the grid section they occurred in, allowing us to calculate unique locational risk scores. As a result, an in-depth understanding of the immediate surroundings is achievable with a simple address or location name.

Measuring Risk
Predicting crime risks
using modern ML
Through multiple iterations and continuous learning, our team has developed a measurement system that calculates potential levels of risk from recent crime incidents.

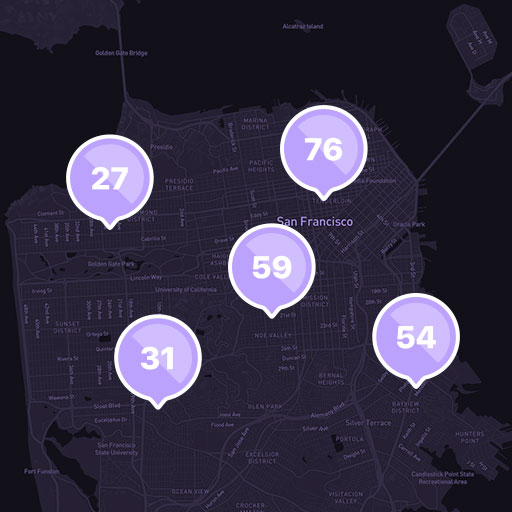
Risk scores across San Francisco.
Simplifying all risks into a single score
Fueled with user-friendly crime data, our
team has developed a proprietary software suite that uses modern machine learning techniques to measure past crime incidents and predictively calculate the current and future potential levels of risk. Each hourly prediction is constantly tested against actual incident data, providing an in-the-moment measure of crime potential.
Thinking of risk as a probability
Based on probabilities, each hourly risk
score is a percentage between 0 - 100. Scores closer to 100 represent a 100% likelihood that something will happen, while scores near 50 are similar to a coin flip, having a 50% probability that it will happen.
Key Learnings
Learning and building
helped us innovate
As we got deeper into creating a risk score, key learnings helped us continually improve its performance.


High accuracy is difficult to achieve
Through trial and error, we have found many variables that subtly affect the accuracy of our model. Examples include the sample size from each grid section and the specificity of each category grouping. By ensuring that grid sections are not too small and category classifications are not too broad, we have improved our accuracy in calculating each risk score.


Risk levels are not static
It may seem like a no-brainer, but we found that risk is not the same throughout the day. Furthermore, by parsing recent incidents by time, crime does not commonly occur at night when we feel unsafe, but instead throughout the day when people are more active. By calculating each hourly risk score from recent incidents, we can visualize how risk changes over 24 hours, helping us keep users informed when we predict it may increase or decrease.


One model will not work everywhere
After analyzing the model performance, we found that a single model could be accurate city-wide but would not calculate an effective risk score for all locations. For example, due to the wide range of incident amounts across a city, one model may perform very well in calculating risk scores for areas with high incidents amounts but may overlook places with very few. As a result, we have developed multiple models that incorporate thresholds based on the characteristics of similar behaving locations, allowing us to calculate effective risk scores across an entire city.
Early Insights
Trusting data can be a
difficult hurdle
Thinking that an area was unsafe made us question if our numbers were accurate.
As San Francisco residents, our team has been able to constantly evaluate the performance of the risk score against our familiarity with the city. This process quickly brought the score accuracy into question, especially when it conflicted with our preconceived biases of what we knew about specific locations. To build trust in its accuracy, we have introduced incident statistics alongside each score to provide more context of the incidents that compose each calculation.


As San Francisco residents, our team has been able to constantly evaluate the performance of the risk score against our familiarity with the city. This process has quickly brought the score accuracy into question, especially when it conflicted with
our preconceived biases of what we “knew” about specific locations. In an attempt to break down these biases and slowly build trust in the scores accuracy, we’ve introduced incident statistics alongside each score to provide better context of what composes each calculation.
Next steps
Continuing to learn
and improve
With a risk measurement system established, the focus has now shifted to visualizing, scaling, and improving our risk scores.
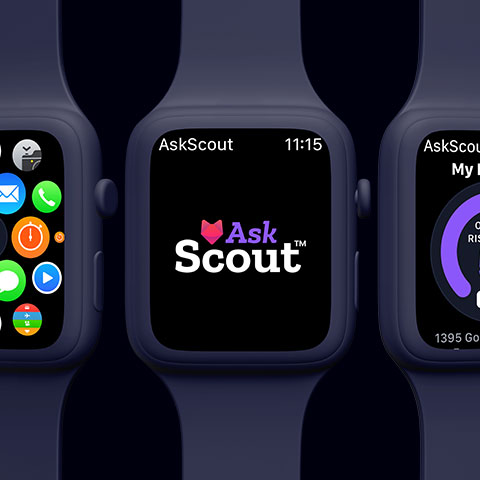
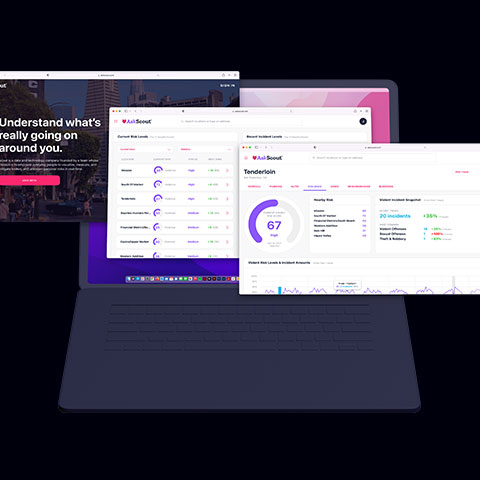
Visualizing data
through touchpoints
Automated and stable, we are now focusing on visualizing risk scores in consumer products to continuously learn how users think of risk, helping us iterate and improve the effectiveness of each score.

Scaling to other cities
Built for San Francisco as a
test market, we have begun identifying data sources of the other large municipalities to scale our risk scores and
market reach.

Exploring data layering
With other datasets identified, we have begun testing the process of layering each dataset over crime data to find correlations that will improve our modeling accuracy.

Extending future predictions
With the ability to forecast
the next 24 hours of risk, we
have begun extending those predictions to unlock feature development around risk planning for travel use cases.